
Kubernetes HPA 基于 Prometheus 自定义指标的可控弹性伸缩
在《Kubernetes 的自动伸缩你用对了吗?》 一文中详细说明了如何使用 Kubernetes 的自动伸缩。在 Kubernetes 中弹性伸缩主要有三种:HPA、VPA、CA。本文不再详细说明,有兴趣的可以看那篇文章。这里主要来说下 Pod 水平缩放 HPA。
随着 Kubernetes v1.23 的发布,HPA 的 API 来到了稳定版 autoscaling/v2:
- 基于自定义指标的伸缩
- 基于多项指标的伸缩
- 可配置的伸缩行为
从最初的 v1 版本 HPA 只支持 CPU、内存利用率的伸缩,到后来的自定义指标、聚合层 API 的支持,到了 v1.18 版本又加入了配置伸缩行为的支持,HPA 也越来越好用、可靠。
依靠 CPU 或者内存指标的扩容并非使用所有系统,看起来也没那么可靠。对大部分的 web 后端系统来说,基于 RPS(每秒请求数)的弹性伸缩来处理突发的流量则会更加靠谱。
Prometheus 也是当下流行开源监控系统,通过 Prometheus 可以获取到系统的实时流量负载指标,今天我们就来尝试下基于 Prometheus 的自定义指标进行弹性伸缩。
注:目前 HPA 的缩容0 (scale to 0),则需要在 feature gate 打开 alpha 版本的 HPAScaleToZero 以及配置一个对象或者外部指标。即使是打开了,从 0 到 1 的扩容需要调度、IP 分配、镜像拉取等过程,存在一定的开销。如果降低这部分开销,这里先卖个关子,后续的文章进行补充。
文章中使用的所有代码都可以从这里下载。
整体架构
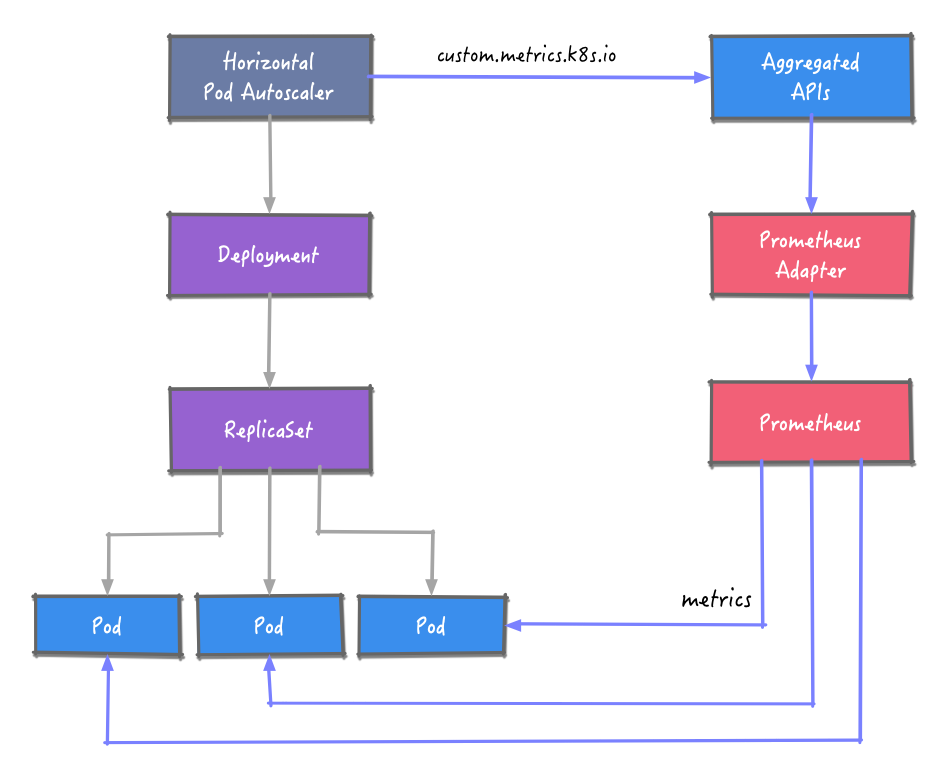
HPA 要获取 Prometheus 的指标数据,这里引入 Prometheus Adapter 组件。Prometheus Adapter 实现了 resource metrics、custom metrics 和 external metrics APIs API,支持 autoscaling/v2 的 HPA。
获取到指标数据后,根据预定义的规则对工作负载的示例数进行调整。
环境搭建
K3s
我们使用最新 1.23 版本的 K3s 作为 Kubernetes 环境。
export INSTALL_K3S_VERSION=v1.23.1+k3s2
curl -sfL https://get.k3s.io | sh -s - --write-kubeconfig-mode 644 --write-kubeconfig ~/.kube/config
示例应用
我们准备一个简单的 web 应用,可以记录请求次数并通过 /metrics 端点输出 Prometheus 格式的指标 http_requests_total。
func main() {
	metrics := prometheus.NewCounterVec(
		prometheus.CounterOpts{
			Name:        "http_requests_total",
			Help:        "Number of total http requests",
		},
		[]string{"status"},
	)
	prometheus.MustRegister(metrics)

	http.HandleFunc("/", func(w http.ResponseWriter, r *http.Request) {
		path := r.URL.Path
		statusCode := 200
		switch path {
		case "/metrics":
			promhttp.Handler().ServeHTTP(w, r)
		default:
			w.WriteHeader(statusCode)
			w.Write([]byte("Hello World!"))
		}
		metrics.WithLabelValues(strconv.Itoa(statusCode)).Inc()
	})
	http.ListenAndServe(":3000", nil)
}
将应用部署到集群:
kubectl apply -f kubernetes/sample-httpserver-deployment.yaml
Prometheus
使用 Helm 安装 Prometheus,先添加 prometheus 的 chart 仓库:
helm repo add prometheus-community https://prometheus-community.github.io/helm-charts
这里的测试只需要用到 prometheus-server,安装时禁用其他组件。同时为了演示效果的实效性,将指标的拉取间隔设置为 10s。
# install prometheus with some components disabled
# set scrape interval to 10s
helm install prometheus prometheus-community/prometheus -n default --set alertmanager.enabled=false,pushgateway.enabled=false,nodeExporter.enabled=false,kubeStateMetrics.enabled=false,server.global.scrape_interval=10s
通过端口转发,可以在浏览器中访问 web 页面。
# port forward
kubectl port-forward svc/prometheus-server 9090:80 -n prometheus
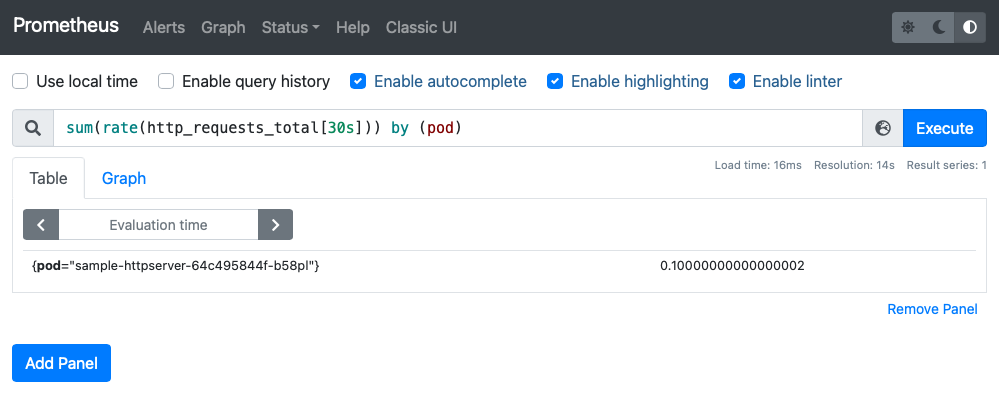
这里查询 Pod 的 RPS 使用 sum(rate(http_requests_total[30s])) by (pod) 语句查询:
Prometheus Adapter
同样使用 Helm 安装 Produmetheus Adapter,这里要进行额外的配置。
helm install prometheus-adapter prometheus-community/prometheus-adapter -n default -f kubernetes/values-adapter.yaml
需要配置 Prometheus Server 的连接,以及如何提取和转换指标的规则,以便 Adapter 能够获取所需的自定义指标数据:
rules:
  default: false
  custom:
   - seriesQuery: '{__name__=~"^http_requests.*_total$",container!="POD",namespace!="",pod!=""}'
     resources:
       overrides:
         namespace: { resource: "namespace" }
         pod: { resource: "pod" }
     name:
       matches: "(.*)_total"
       as: "${1}_qps"
     metricsQuery: sum(rate(<<.Series>>{<<.LabelMatchers>>}[30s])) by (<<.GroupBy>>)
可以参考详细的 Adapter 配置。
待 promethues-adapter pod 成功运行后,可以执行 custom.metrics.k8s.io 请求:
kubectl get --raw '/apis/custom.metrics.k8s.io/v1beta1/namespaces/default/pods/*/http_requests_qps' | jq .
{
  "kind": "MetricValueList",
  "apiVersion": "custom.metrics.k8s.io/v1beta1",
  "metadata": {
    "selfLink": "/apis/custom.metrics.k8s.io/v1beta1/namespaces/default/pods/%2A/http_requests_qps"
  },
  "items": [
    {
      "describedObject": {
        "kind": "Pod",
        "namespace": "default",
        "name": "sample-httpserver-64c495844f-b58pl",
        "apiVersion": "/v1"
      },
      "metricName": "http_requests_qps",
      "timestamp": "2022-01-18T03:32:51Z",
      "value": "100m",
      "selector": null
    }
  ]
}
注意:这里的 value: 100m,值的后缀“m” 标识 milli-requests per seconds,所以这里的 100m 的意思是 0.1/s 每秒0.1 个请求。
HPA
最后就是 HPA 的配置了:
- 最小最大的副本数分别设置 1、10
- 为了测试效果的实效性,设置扩缩容的行为
behavior - 指定指标
http_requests_qps、类型Pods以及目标值50000m:表示平均每个 pod 的 RPS50。比如以 300 的 RPS 访问,副本数就是 300/50=6 。
kind: HorizontalPodAutoscaler
apiVersion: autoscaling/v2
metadata:
  name: sample-httpserver
spec:
  scaleTargetRef:
    apiVersion: apps/v1
    kind: Deployment
    name: sample-httpserver
  minReplicas: 1
  maxReplicas: 10
  behavior:
    scaleDown:
      stabilizationWindowSeconds: 30
      policies:
        - type: Percent
          value: 100
          periodSeconds: 15
    scaleUp:
      stabilizationWindowSeconds: 0
      policies:
        - type: Percent
          value: 100
          periodSeconds: 15
  metrics:
    - type: Pods
      pods:
        metric:
          name: http_requests_qps
        target:
          type: AverageValue
          averageValue: 50000m
测试
测试工具选用 vegeta,因为其可以指定 RPS。
先为应用创建 NodePort service:
kubectl expose deploy sample-httpserver --name sample-httpserver-host --type NodePort --target-port 3000

kubectl get svc sample-httpserver-host
NAME                     TYPE       CLUSTER-IP     EXTERNAL-IP   PORT(S)          AGE
sample-httpserver-host   NodePort   10.43.66.206   <none>        3000:31617/TCP   12h
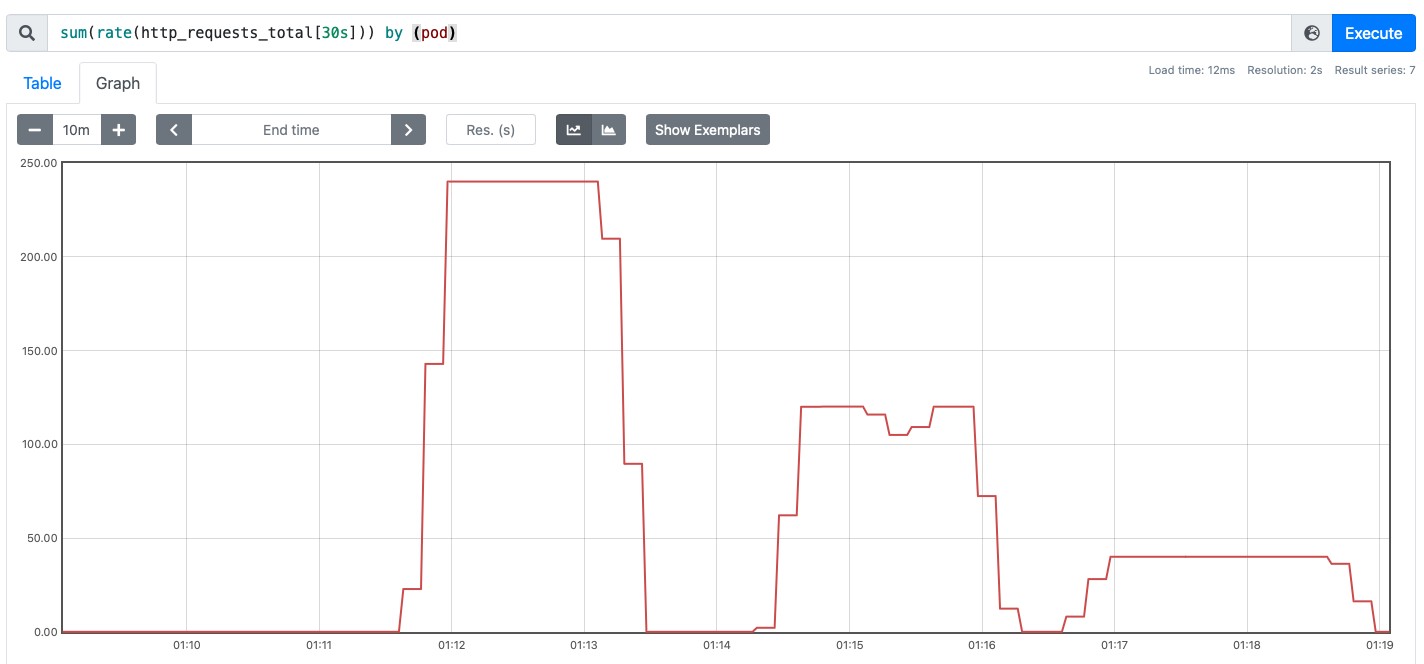
分别使用 240、120、40 的 RPS 发起请求:
# 240
echo "GET http://192.168.1.92:31617" | vegeta attack -duration 60s -connections 10 -rate 240 | vegeta report
# 120
echo "GET http://192.168.1.92:31617" | vegeta attack -duration 60s -connections 10 -rate 120 | vegeta report
# 40
echo "GET http://192.168.1.92:31617" | vegeta attack -duration 60s -connections 10 -rate 40 | vegeta report
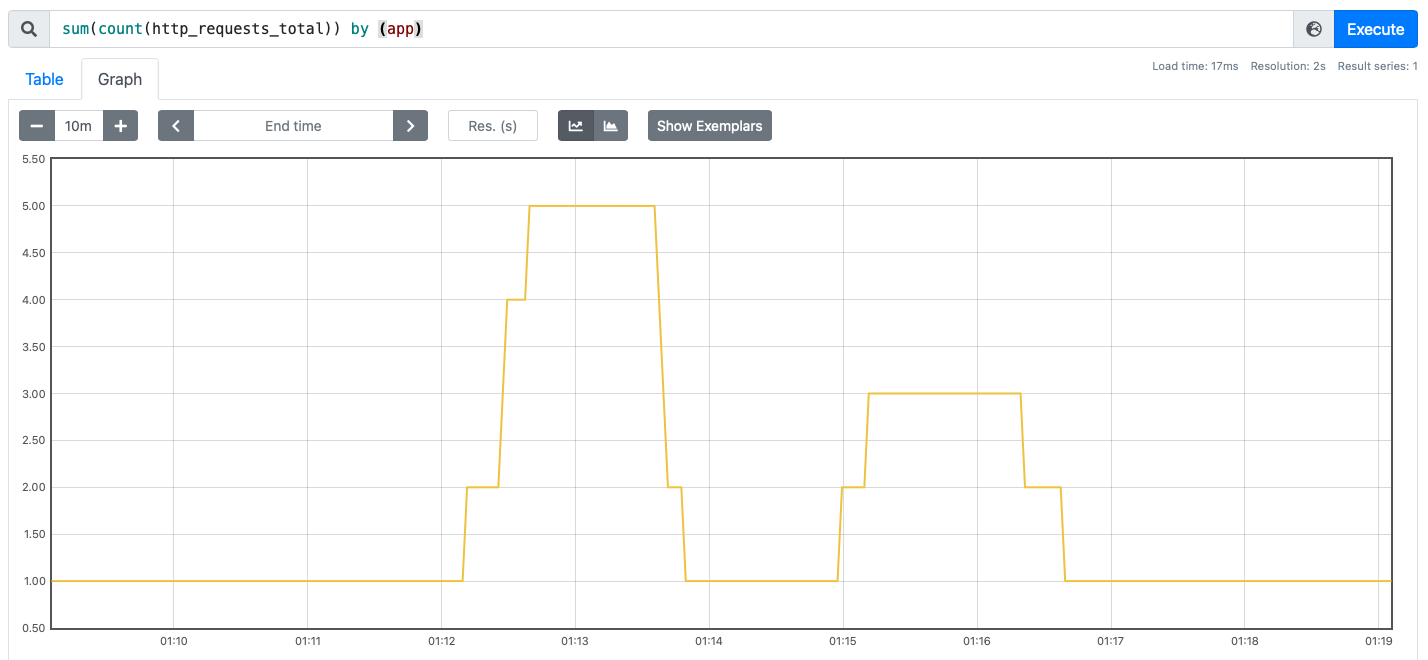
从 Prometheus 的 web 界面上观察请求量与示例数的变化:
kubectl describe hpa sample-httpserver
Warning: autoscaling/v2beta2 HorizontalPodAutoscaler is deprecated in v1.23+, unavailable in v1.26+; use autoscaling/v2 HorizontalPodAutoscaler
Name:                           sample-httpserver
Namespace:                      default
Labels:                         <none>
Annotations:                    <none>
CreationTimestamp:              Mon, 17 Jan 2022 23:18:46 +0800
Reference:                      Deployment/sample-httpserver
Metrics:                        ( current / target )
  "http_requests_qps" on pods:  100m / 50
Min replicas:                   1
Max replicas:                   10
Behavior:
  Scale Up:
    Stabilization Window: 0 seconds
    Select Policy: Max
    Policies:
      - Type: Percent  Value: 100  Period: 15 seconds
  Scale Down:
    Stabilization Window: 30 seconds
    Select Policy: Max
    Policies:
      - Type: Percent  Value: 100  Period: 15 seconds
Deployment pods:       1 current / 1 desired
Conditions:
  Type            Status  Reason              Message
  ----            ------  ------              -------
  AbleToScale     True    ReadyForNewScale    recommended size matches current size
  ScalingActive   True    ValidMetricFound    the HPA was able to successfully calculate a replica count from pods metric http_requests_qps
  ScalingLimited  False   DesiredWithinRange  the desired count is within the acceptable range
Events:
  Type    Reason             Age                  From                       Message
  ----    ------             ----                 ----                       -------
  Normal  SuccessfulRescale  25m                  horizontal-pod-autoscaler  New size: 6; reason: pods metric http_requests_qps above target
  Normal  SuccessfulRescale  19m                  horizontal-pod-autoscaler  New size: 4; reason: All metrics below target
  Normal  SuccessfulRescale  12m (x2 over 9h)     horizontal-pod-autoscaler  New size: 4; reason: pods metric http_requests_qps above target
  Normal  SuccessfulRescale  11m                  horizontal-pod-autoscaler  New size: 5; reason: pods metric http_requests_qps above target
  Normal  SuccessfulRescale  9m40s (x2 over 12m)  horizontal-pod-autoscaler  New size: 2; reason: pods metric http_requests_qps above target
  Normal  SuccessfulRescale  9m24s (x4 over 10h)  horizontal-pod-autoscaler  New size: 3; reason: pods metric http_requests_qps above target
  Normal  SuccessfulRescale  7m54s (x3 over 9h)   horizontal-pod-autoscaler  New size: 2; reason: All metrics below target
  Normal  SuccessfulRescale  7m39s (x4 over 9h)   horizontal-pod-autoscaler  New size: 1; reason: All metrics below target
总结
基于自定义指标比如每秒请求量进行应用的水平扩容相比 CPU/内存 作为依据更加靠谱,适用于大部分的 web 系统。在突发流量时可以进行快速扩容,通过对伸缩行为的控制,可以减少副本数的抖动。Promeheus 作为流行应用的监控系统,在 Adapter 和 Aggregate API 的支持下,可以作为伸缩的指标。
目前 HPA 的 scale to 0 还在 alpha 的阶段,还需要关注副本从 0 到 N 的实效性。如果最小副本数大于0 ,对某些服务来说又会占用资源。接下来,我们会为尝试解决 0 到 N 的性能,以及资源占用的问题。